


A Tale of Two Markets
Adapting to the Current Opportunity Set

I’ve witnessed many investors make terrible investment decisions from thinking via the index. The most common mistake is to view the index (indeed any index?) as a risk free “home”. That this disposition still exists after the irrational index bubbles that preceded the Asian crisis and technology collapse may be testament to the strength of the marketing skills of the financial establishment. Once the index is seen as risk free the mistakes that follow cascade and include: requirement to have an opinion on everything inside the index regardless of one’s circle of competence, an unwillingness to invest in other better opportunities, and over diversification. These three mistakes destroy a lot of capital.
We are walking down the road less traveled when we argue that the index is not risk free, it is one, of many, opportunity sets. This year that opportunity set beat us. It may do so again next year too. And the year after that. We should all be prepared for that possibility and stoic at its occurrence. A rational mind understands that it is the destination that is important, and if we have some skill in picking stocks (please, no answers on a post card!) then, whilst annual returns may bounce around, our destination will be some way ahead of the index. Zak and I are not envious of index returns and we encourage you not to be either. We see our goal as far more personal than that. Our goal is a track record to be proud of, we wish to accomplish something meaningful, and to do that we aim to earn returns, over time, on par with those investors we greatly admire (Ruane, Tweedy, Klarman, Whitman, Hawkins, Miller, Schloss, Berkowitz). In no way do we guarantee returns, but if we can approach their results then, over time, we will beat the index too.
— Nick Sleep
The start of 2025 brough with it an extreme change in sentiment! Between tariffs (and the back and forth), weaker than expected payroll data, large job cuts due to DOGE, and negative GDP forecasts (-2.4% from Atlanta Fed’s Q1’25 estimate), confidence has been waning. We seem to be far away from the post-election rally, and some are even claiming that it’s our government’s intention to cause a market decline.
Now, I am not a macro expert nor do I spend much time forecasting. I prefer to study businesses and focus on finding good individual investment ideas. However, I wanted to share some thoughts I have on the broad market, some of which I shared with client’s during the Greystone Capital Annual Partner’s Meeting this week. I think sentiment is important to monitor, at least in part because during the past decade, multiple expansion drove a large majority of index appreciation, stretching valuations to extremes. Swings in the other direction could have a drastic impact.
*Some of the following was excerpted from the Greystone Capital 2024 Annual Partners Meeting.
I am going to spend some time talking about the broad market and some of the things I’m seeing, and maybe what that means for us potentially based on how we’re positioned. But as you know I don’t like to spend a ton of time thinking about anything other than our companies. I am certainly aware of macro risks, and don’t try to dance in and out of the market or investments to avoid potential shocks, but it’s not a day-to-day focus of mine. The economy is a complex, dynamic, non-linear system that is impossible to predict and impossible to outsmart.
So what I’m seeing today at least in public markets is sort of a tale of two markets. In the below chart, you’ll see the forward P/E ratio of the S&P, approaching an all-time high.

Next you’ll see a picture of small cap valuations. This is the relative valuation spread (as measured by EV/EBIT) between large caps and small caps, at multi-decade lows based on where we are today. Small cap valuations finished 2024 at their lowest relative point in 25 years. The Russell was up +11.5% during 2024 but marked the 8th straight year of underperformance relative to large cap stocks. This is the longest underperformance stretch since the index inception in 1978.
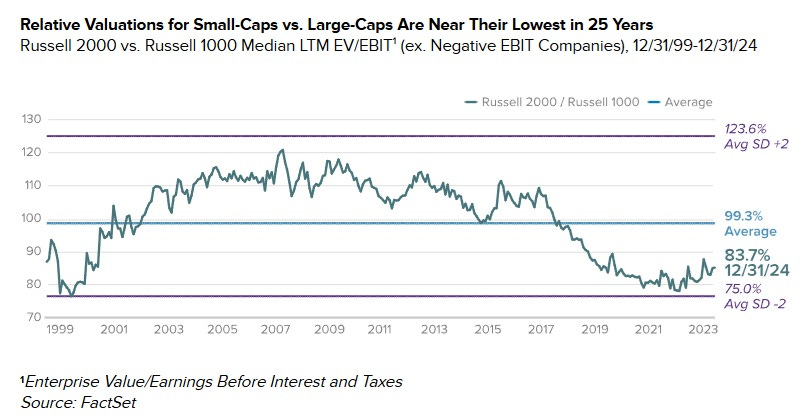
The chart below illustrates further the gap in valuations between the Russell 2000 and the S&P 600 index. The disparity is nearly 12 turns lower.

In my opinion, there are a few reasons for the valuation discrepancies, starting with fund flows.
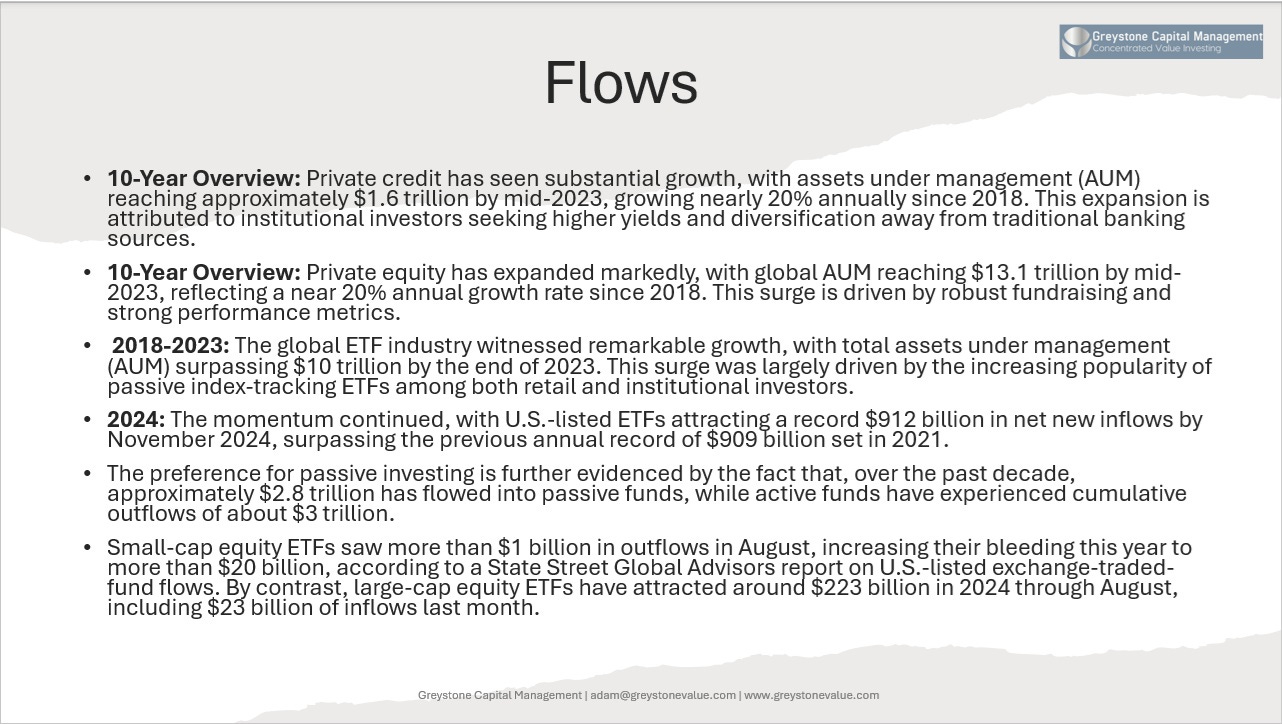
The above chart outlines some flows data, revealing that during various 5-10 year periods, flows into asset classes such as Private Credit, Private Equity, ETFs and until 2022, Venture Capital, have all been substantial. Private Credit grew 20% per year since 2018, private Equity was the same. ETFs have now surpassed $10 trillion in AUM as of the end of 2024, and saw nearly $1 trillion in inflows last year, an annual record, surpassing 2021.
Compare this to actively managed funds, which have experienced around $3 trillion in outflows during the past decade (versus around $3 trillion in inflows for passive vehicles). For small caps in particular, last year saw an outflow of $20 billion according to State Street, while large cap ETFs were responsible for around 10% of total inflows from last year, or $220 billion. The difference is remarkable.
So, if small caps are undervalued, and have historically outperformed large caps coming out of periods like this one, where are the flows? Why aren’t dollars being allocated to these companies and strategies?
There are a few reasons:
First, our industry has shrunk considerably. According to IBIS World, the number of actively managed small cap funds has shrunk by more than 35% from a decade ago.
Large cap stocks no longer seem to be volatile. Volatility was near absent during 2023 and 2024. See the quote at the top of this post. Investors, who have incredibly short memories, can get complacent very quickly, adopting the mentality of ‘why own anything else?’
The amount of private investment capital has increased considerably. See the above comments on flows. Private investments aren’t subject to mark to market fluctuations, making them seem more attractive than volatile small stocks.
With the Russell 2000 providing exposure to many cyclicals, weak earnings growth expectations and declining credit quality (half the index is unprofitable), the narrative surrounding small stocks is that they are lower quality than large caps.
Finally, the S&P’s relative strength during the past decade, as discussed.
Anecdotally, many conversations I have with investors, family offices, institutions, individual investors take some form of why won’t these companies stay cheap forever? Small caps are dead. You’ll never scale. Liquidity is an issue. Small caps are lower quality businesses than large caps. There are an incredible number of reasons why small public companies are being overlooked, ignored or viewed as something they are not.
Turning back to the S&P, it’s no secret that the S&P has delivered strong returns over 3, 5, and 10 years. Aside from the dot com bubble where the index generated five straight years of +20%+ returns, we haven’t seen performance like this in 20 years. It’s made for a formidable competitor. But again, going back to that chart I showed, the price you pay matters, and there is a case to be made that the market does not continue its upward trajectory.
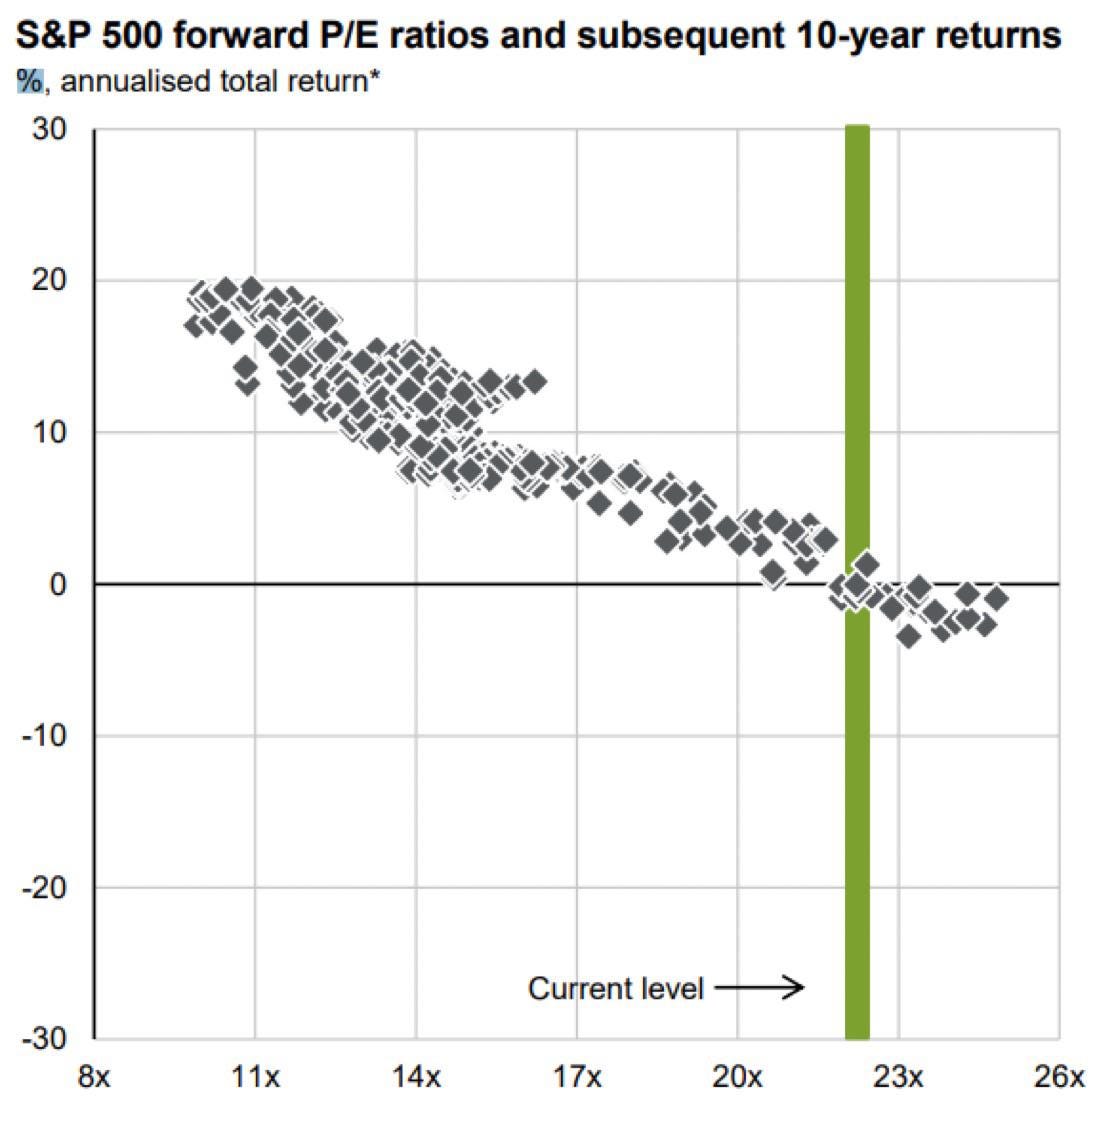
The chart below, which I’ve seen in many places during the past few months, is the S&P’s historical subsequent 10-year returns at various P/Es throughout history. As you can see by the chart, forecasted returns for the next decade are flat to negative based on the S&Ps current P/E of 22x forward earnings. Unless you believe something within the market or economy has drastically changed from history (i.e. this time is different) these charts may have some predictive value.
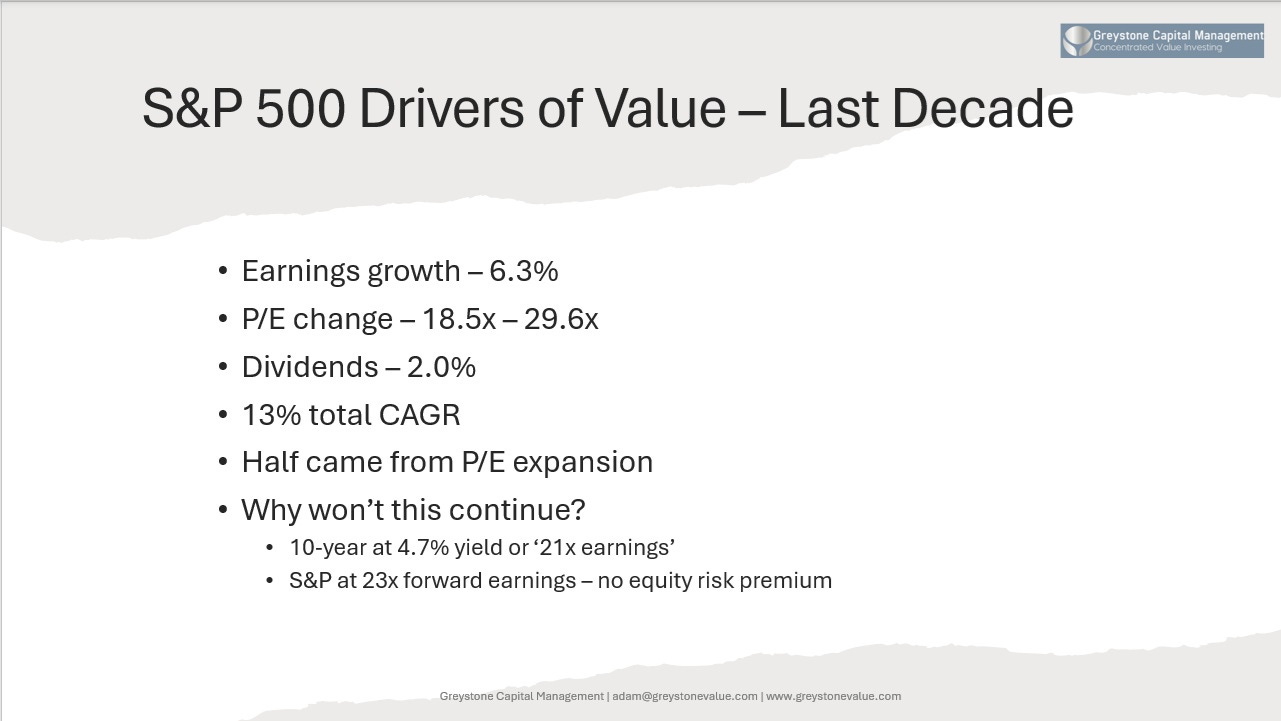
The index is expensive. The current dividend yield for the S&P 500 is 1.3%, historically low given the current valuation. The most recent buyback yield is somewhere around 2.0%. That’s a total shareholder yield of 3.3%. So moving forward, you’re relying a tremendous amount on earnings growth and then multiple expansion for your return. If you look at the figures on the below slide, during the past decade, S&P earnings grew above 6.0%, while the P/E went from less than 19x to nearly 30x. The 13% total 10 year return was delivered in large part by multiple expansion. Tough to replicate.
In this excellent post by Eagle Point Capital, the group outlines why similar multiple expansion is unlikely.
A good proxy for the current risk premium is to look at the earnings yield of the stock market vs. the 10-year yield on U.S. treasuries. The current rate on the 10-yr is about 4.7%. In other words, the 10-yr trades for about 21x “earnings” (1 divided by the interest rate). This also means there really is no equity risk premium for the stock market given the current valuation is above the 10-yr yield. This is another data point suggesting that continued multiple expansion is unlikely. Again, not impossible, but not likely.
So what about earnings growth? As we all know, stock prices follow growth in earnings per share.

Earnings growth is the product of a company’s reinvestment rate and the incremental return on invested capital.
Growth rate = reinvestment rate x return on equity
The S&P 500 currently spends 30% of earnings on dividends and 47% on buybacks, leaving 23% for reinvestment. With an average return on equity of 13.3% during the past decade, that means a 3.0% growth rate is appropriate for the index moving forward. Keep in mind these are conservative averages. Earnings have grown 14% and 10% on average during the past 10 and 20 years. Over a longer time frame, that number is in the mid-single digits.
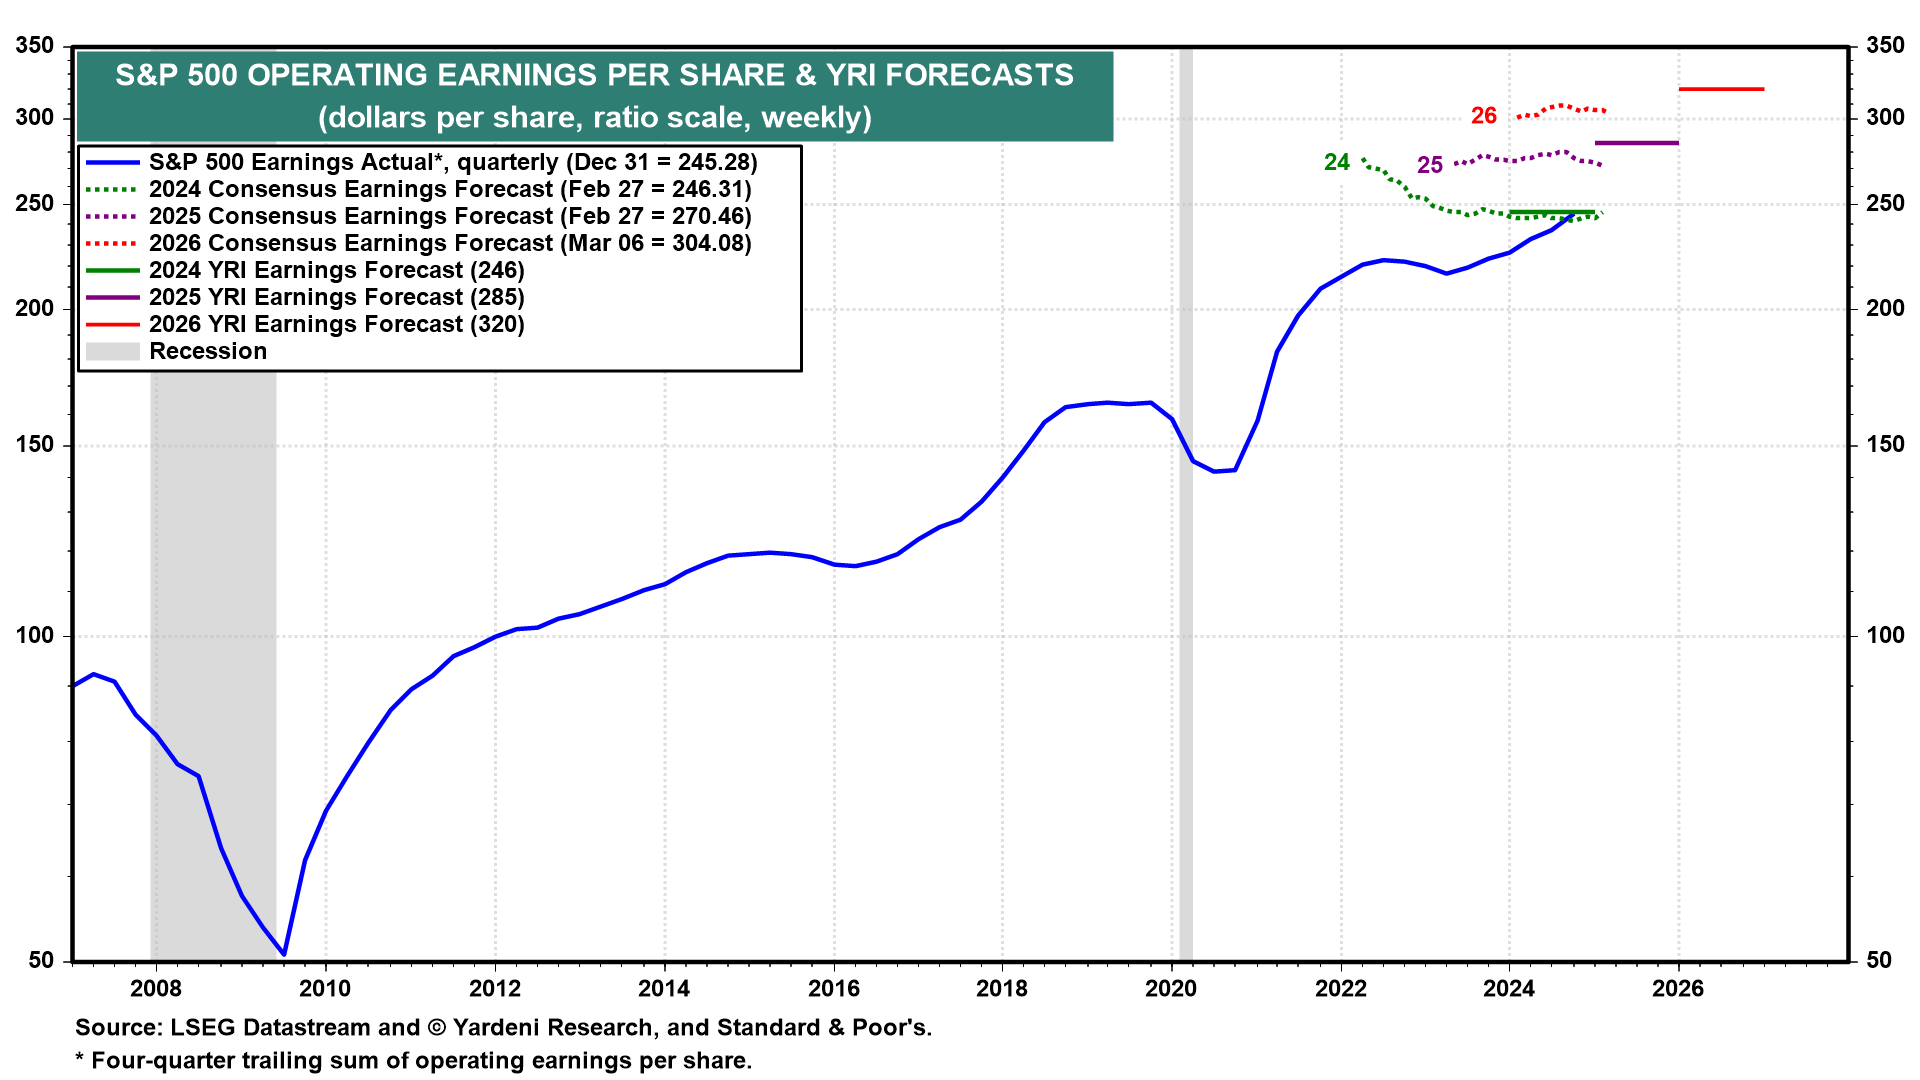
Yet, the market sees no slowdown in earnings growth, with consensus earnings forecasts expected to grow nearly 10% for 2025 and 13% for 2026. Beyond that, as a simple math exercise, double digit growth over a longer time frame, without the benefit of massive productivity gains is unlikely. I say unlikely, because maybe AI means this time is different. But base rates and averages matter.
During the past two decades, earnings growth was negative 35% of the time, and the averages are skewed by strong recoveries in 2009 and 2010 (the median earnings growth over two decades is 10.9%).
Now if I offered to sell you a company for 22x earnings, with a 13x ROE, that was growing just 3% per year, and yielding a 3.0% distribution on top of that, would you be interested? What if that company was also at peak margins, likely to mean revert over time? It certainly doesn’t scream bargain, and has the potential to severely disappoint.
The S&P 500 cap weighted index, versus the equal weighted index, is obviously being driven by a handful of large companies, which I and others have talked about ad nauseam, so won’t get into here, but continued performance of this nature for the next decade is also unlikely. In a recent episode of The Acquirer’s Podcast, Portfolio Manager Andrew Wellington outlines why the cap weighted index will likely struggle moving forward.
“…so one simple way to do this is just look at the PE on the S&P 500 equal weight index. It’s all the same names just each one gets a 0.2% weighting instead of whatever the cap weighted weights are. At year end the S&P 500 was what like 21x I think, and the equal weight index was 16.5x which seems really reasonable for the overall market. So there's so much skew and it is the Magnificent Seven, but it's way bigger than that. It goes far beyond that.
So, at year end the S&P 500 PE was about 32% higher than the equal weight index. And people say well maybe that's deserved because I'm sure the cap weighted index has had much better earnings growth with the Magnificent 7 and Nvidia and all these amazing stocks the cap weighted index has to have grown faster. But when you actually look at the earnings history it hasn't. So we had 15 years of data on the earnings growth of the equal weight index and we split it up into two halves and for the first seven and a half years the equal weight index grew about two percentage points a year faster than the cap weighted index.
…even with that, they had about the same PE the entire time. But even then there was a little bit of PE multiple compression where the cap weighted index went from a 2% discount to like an 8% premium. But for the most part they had about the same PE even though the cap weight index grew more than two percentage points a year slower for seven and a half years. Then we looked at the last seven and a half years and it's a little better for the cap weighted index but only because it's grown exactly the same rate as the equal weighted index. So there's been no earnings growth at all. But it went from basically parity to a 32% premium. It’s multiple growth not better earnings growth. Well maybe the market's looking forward and it should be looking forward. But even then, when you pull up the consensus estimates, they do have the cap weighted index growing faster, but only about 1% a year faster for the next couple years, and who knows if that will be right. So there really isn't a fundamental case that supports the cap weighted index being such a high premium over the equal weight. So we ran the math. What if they converged over the next five years? I think the number came out to be around almost -40 percentage points of cumulative underperformance about 600 basis points a year of underperformance for them to end up if they had the same earnings growth and the same PE at the end of this period. Now that seems like a huge amount of underperformance, but then we went back and looked at every other time when the cap weighted index had outperformed the equal weight index by that much, and if anything that history says it's usually a little bit more than -40 percentage points. So it all looks really bad for the cap weighted index.”
Here’s my back of the napkin math.
2025 consensus earnings forecasts call for $270 EPS. Growing that figure at 6% per year for a decade gets us to $483 EPS. At the same earnings multiple of 22x earnings, implying near perfect conditions a decade from now, the index value would be $10,637, or 86% higher than today’s value of $5,685. An 86% return over 10 years equates to a 6% IRR. That’s if everything goes perfectly, and there is no change in multiple. If the multiple compresses to just 19x at the end of the decade, the IRR drops to 5%. And so on if the multiple compresses further. This compares to the 10-year at 4.3%. Not very attractive. Maybe this time will actually be different. But if history repeats, it’s not likely.
After reading Charles Darwin’s On the Origin of Species, in 1864, Herbert Spencer coined the phrase “survival of the fittest” as a shorthand for Darwin’s theory of evolution. The phrase has since been distorted to justify corporate takeovers, wars, genocides, and ruthless power struggles. What Spencer meant, ‘was not that the strongest and the smartest [are] destined to succeed, but rather that those organisms that are best adapted [to] ‘fit’ into any particular environmental niche will thrive.’ More than strength, intelligence, or a grand plan, surviving and thriving requires the ability to recognize a condition and respond to that condition, to adapt to the conditions of your present circumstances.
The S&P has show remarkable strength during the past decade, from low starting valuations and large cap tailwinds unlikely to persist. As a result, it’s time to adapt to current conditions and search for a different opportunity set.
The best path forward is to own good businesses that are growing, offer high returns on equity, strong capital allocation and valuations well below the broad market. In other words, companies that can compound their value at much higher rates than the market. NRP trades at a single digit multiple of cash flow, and offers a 20% distribution yield, with upside potential on the units. Medical Facilities Corp. trades at 10x free cash flow, is growing that free cash flow 4% per year, and repurchasing another 15-20% of the business per year. Sylogist is trading at 12x EBITDA, growing annual recurring revenue at 20%+, and cash flow is set to accelerate at similar rates within 12 months. I will gladly hold these bargains as an alternative to what else is out there. It doesn’t mean our companies can’t see their multiples compress in the near term, or their stocks bounce around, but pose little financial risk, other than being unloved. That’s a tradeoff I’ll take.
Adam Wilk is the Founder and Portfolio Manager of Greystone Capital Management LLC, a small cap focused investment firm.
Adam can be reached at adam@greystonevalue.com
Disclaimer: Adam Wilk and clients of Greystone Capital Management own shares of NRP, MSCSF and SYZLF. The purpose of this post is for informational and educational purposes only and should not be construed as a recommendation to purchase or sell any security. Do your own due diligence and seek counsel from a registered investment advisor before trading in any security mentioned.